Math5620
Author: David Merkley
Language: Python
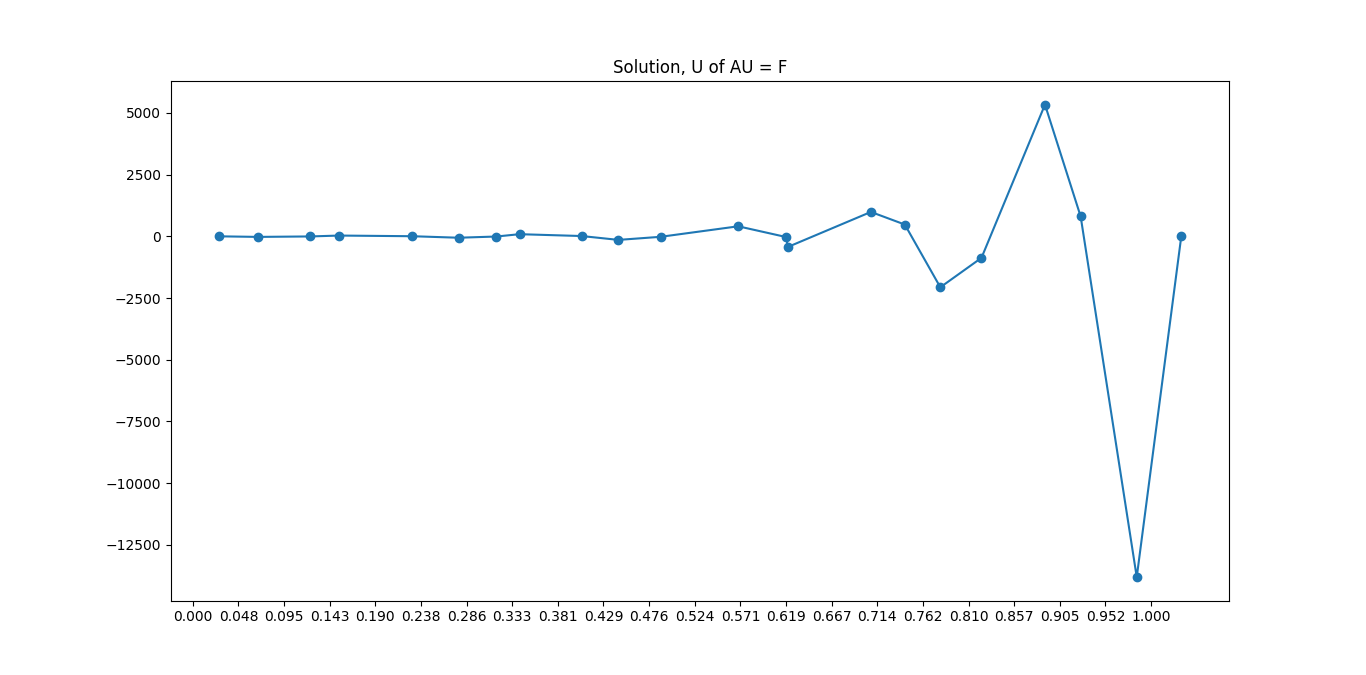
Description/Purpose: This code solves a BVP, calculates the error, and calculates a 2-norm of the error. Then it plots all of this information.
Implementation/Code:
import random
import numpy as np
random.seed(10)
from matplotlib import pyplot as plt
import math

def gridMappingFunc(i, h):
    return i * h

def u(x):
    return x + 2

def c1(x, y, z):
    return 2 / ((y - x)*(y - x + z - x))

def c2(x, y, z):
    return 2 / (y - x + z - x)

def c3(x, y, z):
    return 2 / ((z - x)*(y - x + z - x))

def main():
    xticks = []
    xValues = []
    A = np.zeros((22, 22))
    F = np.zeros(22)
    for n in range(22):
        xValues.append(random.uniform(n/21, (n+1)/21))
        xticks.append(gridMappingFunc(n, 1/21))

    for n in range(22):
        if n == 0:
            F[0] = 2
        elif n == 21:
            F[n] = 3
        else:
            F[n] = 0

    for n in range(22):
        for m in range(22):
            if n == 0 and m == 0:
                A[0][0] = 1
            elif n == 21 and m == n:
                A[n][m] = 1
            elif n == m:
                A[n][m] = c2(xValues[n - 1], xValues[n], xValues[n + 1])
                A[n][m - 1] = c1(xValues[n - 1], xValues[n], xValues[n + 1])
                A[n][m + 1] = c3(xValues[n - 1], xValues[n], xValues[n + 1])

    U = np.linalg.solve(A, F)

    print("The solution U is:\n", U)
    plt.plot(xValues, U, marker='o')
    plt.title("Solution, U of AU = F")
    plt.xticks(xticks)
    plt.yticks()
    plt.show()
main()
Output:
The solution U is:
 [ 2.00000000e+00 -2.13238104e+01 -2.64276649e+00  3.32003319e+01
  5.87242354e+00 -5.48013367e+01 -5.89428622e+00  8.86401865e+01
  1.38367204e+01 -1.42655621e+02 -1.78994915e+01  4.08296470e+02
 -2.45295709e+01 -4.25797924e+02  9.90161368e+02  4.79413181e+02
 -2.06221123e+03 -8.69928735e+02  5.33815831e+03  8.06358191e+02
 -1.38065241e+04  3.00000000e+00]