Math5620
Author: David Merkley
Language: Python
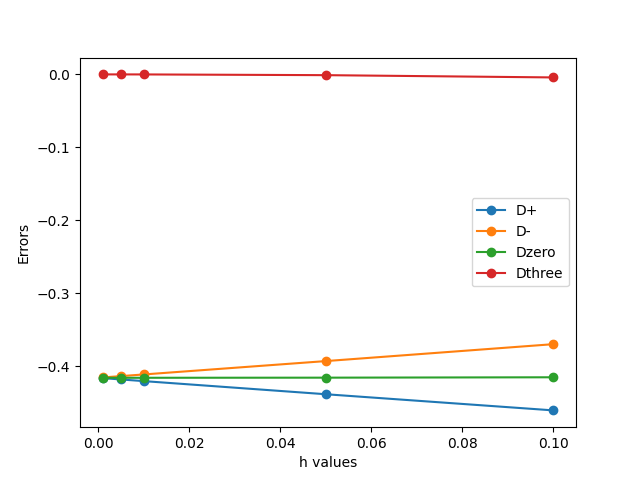
Description/Purpose: This code uses finite difference formulas to approximate u’(x). Then it creates a table of all the errors and plots this information.
Implementation/Code:
import math
import matplotlib.pyplot as plt

# Finding error in finite difference approximation for D+
def Dplus(x, h):
    return round((math.sin(x + h) - math.sin(x)) / h, 8)

# Finding error in finite difference approximation for D-
def Dminus(x, h):
    return round((math.sin(x) - math.sin(x - h)) / h, 8)

# Finding error in finite difference approximation for D0
def Dzero(x, h):
    return round(.5 * (Dplus(x, h) + Dminus(x, h)), 8)

# Finding error in finite difference approximation for D3
def Dthree(x, h):
    return round((1 / 6 * h) * ((2 * math.sin(x + h)) + (3 * math.sin(x)) - (6 * math.sin(x - h)) + math.sin(x - (2 * h))), 8)

def main():
    x = 2
    DList = []
    DplusList = []
    DminusList = []
    DzeroList = []
    DthreeList = []
    LegendList = ["Dplus", "Dminus", "Dzero", "Dthree"]
    hValueList = [0.1, .05, .01, .005, .001]

# This loop creates tuples of all the errors that are used later to create the table and plot the information.
    for n in hValueList:
        holderArray = [Dplus(x, n), Dminus(x, n), Dzero(x, n), Dthree(x, n)]
        DList.append(holderArray)

        DplusList.append(Dplus(x, n))
        DminusList.append(Dminus(x, n))
        DzeroList.append(Dzero(x, n))
        DthreeList.append(Dthree(x, n))

# This creates the table for the errors
    format_row = "{:>12}" * (len(LegendList) + 1)
    print(format_row.format("h", *LegendList))
    for column, row in zip(hValueList, DList):
        print(format_row.format(column, *row))

# This plots all of the information for the plot
    plt.plot(hValueList, DplusList, label="D+", marker="o")
    plt.plot(hValueList, DminusList, label="D-", marker="o")
    plt.plot(hValueList, DzeroList, label="Dzero", marker="o")
    plt.plot(hValueList, DthreeList, label="Dthree", marker="o")
    plt.ylabel("Errors")
    plt.xlabel("h values")
    plt.legend()
    plt.show()

main()
Output:
       h       Dplus      Dminus       Dzero      Dthree
     0.1  -0.4608806 -0.37002661  -0.4154536  -0.0041607
    0.05 -0.43870116 -0.39324576 -0.41597346 -0.00104034
    0.01 -0.42068635 -0.41159345  -0.4161399  -4.161e-05
   0.005 -0.41841834 -0.41387186  -0.4161451   -1.04e-05
   0.001 -0.41660142 -0.41569212 -0.41614677    -4.2e-07